Work Atlas
Räumliche Arbeiten von überall auf The Spatial Net. Jede Probe stammt von einer Fachkraft und ist am dargestellten Ort verortet. Dieselben öffentlichen Arbeitsproben erscheinen als Ebene auf The Geo Map.
Veröffentlichen Sie Ihre eigene Arbeit
Zeigen Sie Ihre Arbeit auf The Spatial Net: veröffentlichen Sie eine Karte, einen Datensatz, Bilddaten oder eine Analyse und verorten Sie sie am dargestellten Ort. Wir übernehmen niemals fremde Arbeiten; der Work Atlas ist Opt-in der Urheber, mit Quellenangabe und Rückverweis.
Kürzlich veröffentlichte Arbeiten
Die neuesten öffentlichen Arbeiten auf The Spatial Net, neueste zuerst.
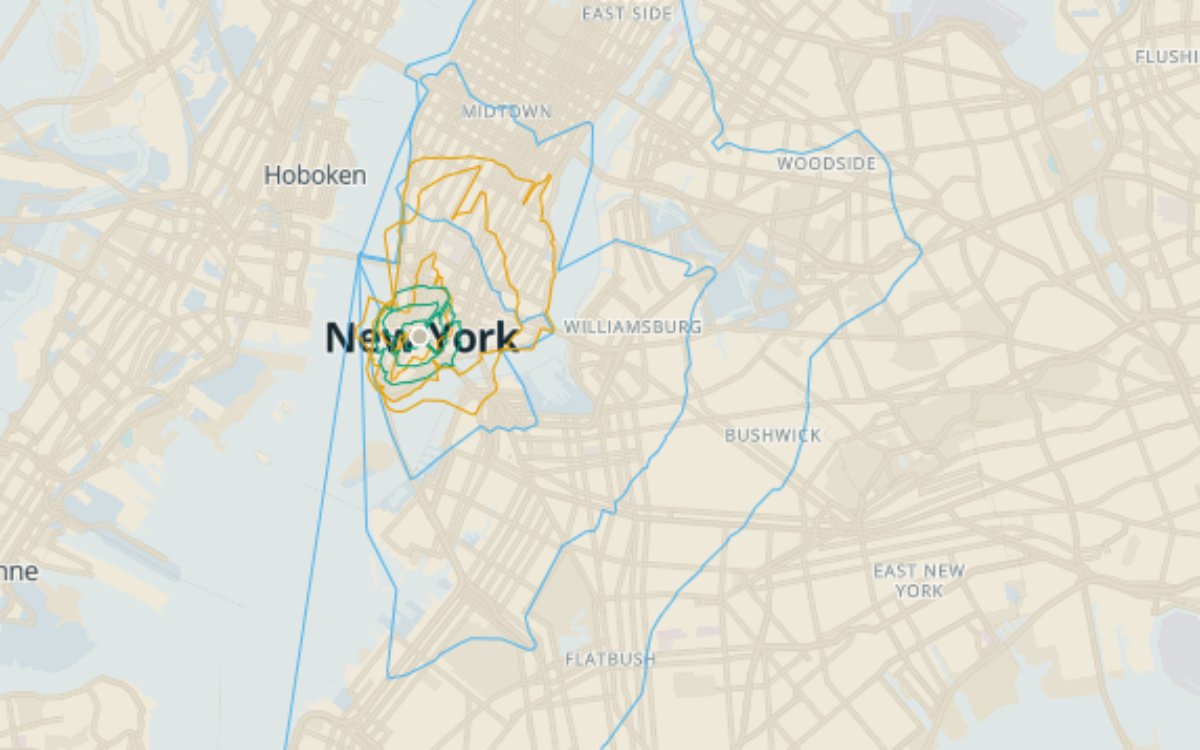
15 minutes from City Hall: walk vs bike vs drive
One origin, three modes, one clock. From NYC City Hall, 15 minutes of walking reaches 2.75 km2, 15 minutes of cycling reaches 15.95 km2, and 15 minutes of freeflow driving reaches 151.62 km2: a 55x spread from the same corner of Manhattan. Bands at 5, 10, and 15 minutes per mode, computed on NYC's official LION street network. The three modes nest cleanly (containment 1.0 at every time cut: walk within bike within drive), so the map reads as three families of contours radiating from one point. Each band carries area_km2 and node_count in its feature properties. Companion to the five-borough walking map, which holds mode constant and varies the origin; this one holds the origin constant and varies the mode. Drive times use freeflow edge costs (no traffic adjustment) so results are reproducible.
pmtilesAnalyseErstellt Erstellt: auf The Spatial Net angelegtReproduzierbarPostgreSQL 17PostGISpgRouting 3.8FastAPI+1Aktualisiert vor 4 Tagen
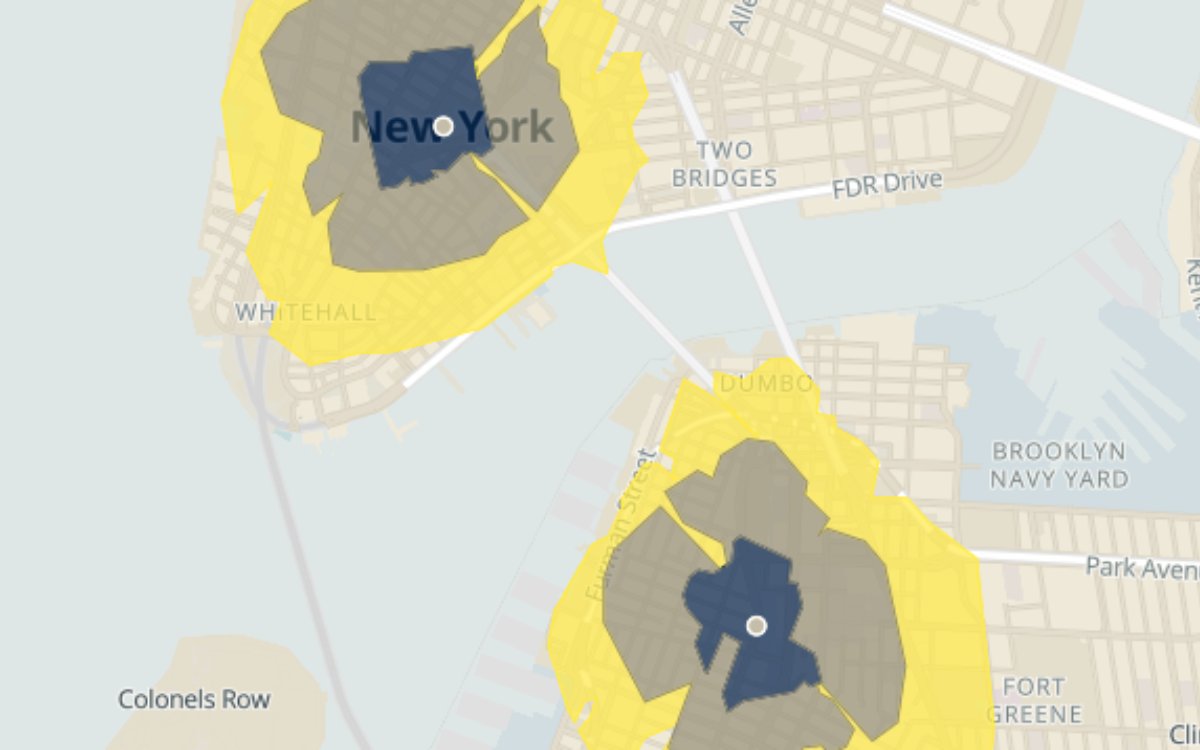
How far can you walk in 15 minutes from each NYC borough hall?
Walking reachability from the five borough civic centers (City Hall, Brooklyn Borough Hall, Queens Borough Hall, Bronx County Courthouse, Staten Island Borough Hall), computed as 5, 10, and 15 minute walk isochrones on NYC's official LION street network and rendered as nested ring bands around each origin point. Measured, the contrast is not where you would guess. Four of the five 15-minute walksheds are nearly the same size: City Hall 2.75 km2 (most of the Financial District), Brooklyn 2.73, the Bronx 2.59, Queens 2.24. Staten Island is the outlier at 1.55 km2, 1.8x smaller than City Hall. The larger gap is street-network density: 15 minutes reaches 896 nodes from City Hall but only 339 from Staten Island Borough Hall. Each band carries area_km2 and node_count in its feature properties. The same open routing stack also produces bike and drive isochrones; this map isolates walking so the per-borough contrast stays legible.
pmtilesAnalyseErstellt Erstellt: auf The Spatial Net angelegtReproduzierbarPostgreSQL 17PostGISpgRouting 3.8FastAPI+1Aktualisiert vor 4 Tagen
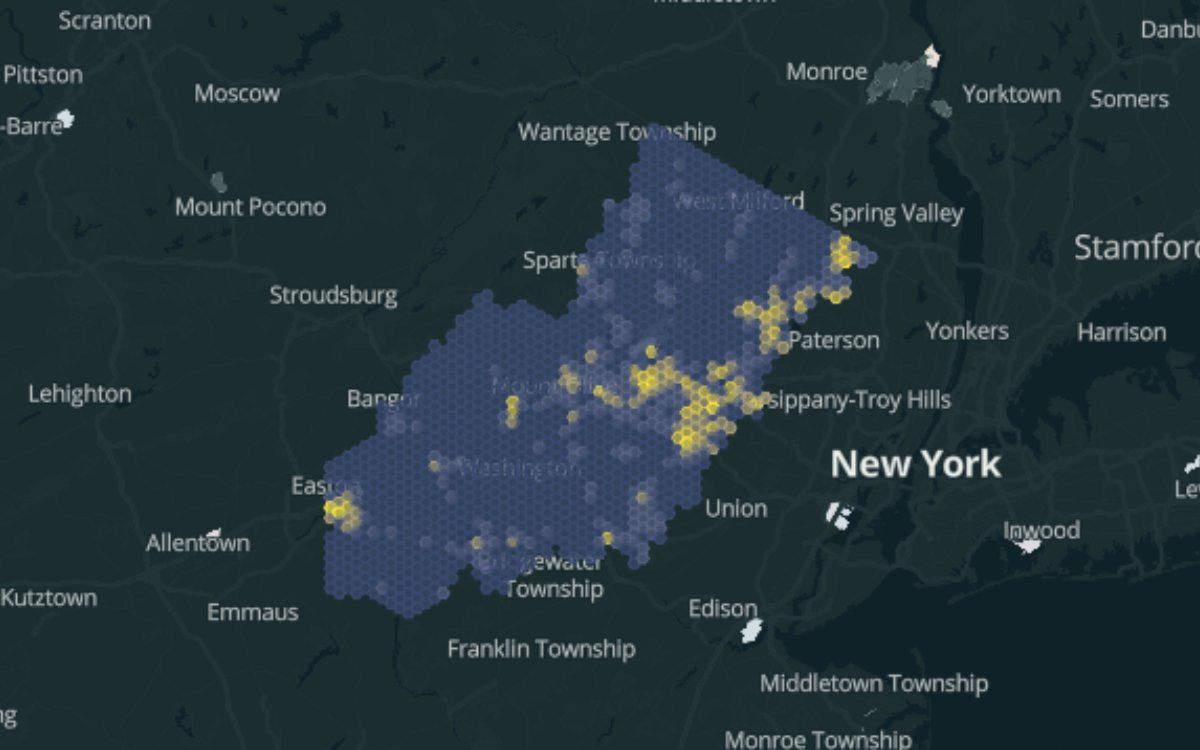
Where the ground is hardest: machine-mapped impervious surface across the NJ Highlands, 2020
Impervious surface share across the New Jersey Highlands region (3,475 km2 of watershed lands supplying drinking water to much of northern New Jersey), aggregated to a hexagonal grid (1 km edge, roughly 2.6 km2 cells). The source layer was machine-mapped from NJGIN four-band aerial imagery with a Raster Vision semantic segmentation pipeline I built and operated for the NJ Highlands Council: 1,651 image tiles per imagery epoch, inference distributed across 10 to 20 AWS Spot instances, predictions vectorized and published by the Council as open data. Region-wide, 8.3 percent of Highlands land was impervious in 2020 (287 km2); the densest cell is 55 percent. Each hex carries land area, impervious area, and percent, so you can restyle or re-threshold it in any GIS.
pmtilesAnalyseErstellt Erstellt: auf The Spatial Net angelegtReproduzierbarRaster Vision (PyTorch semantic segmentation)AWS EC2 SpotGDALPostGISAktualisiert vor 16 Tagen
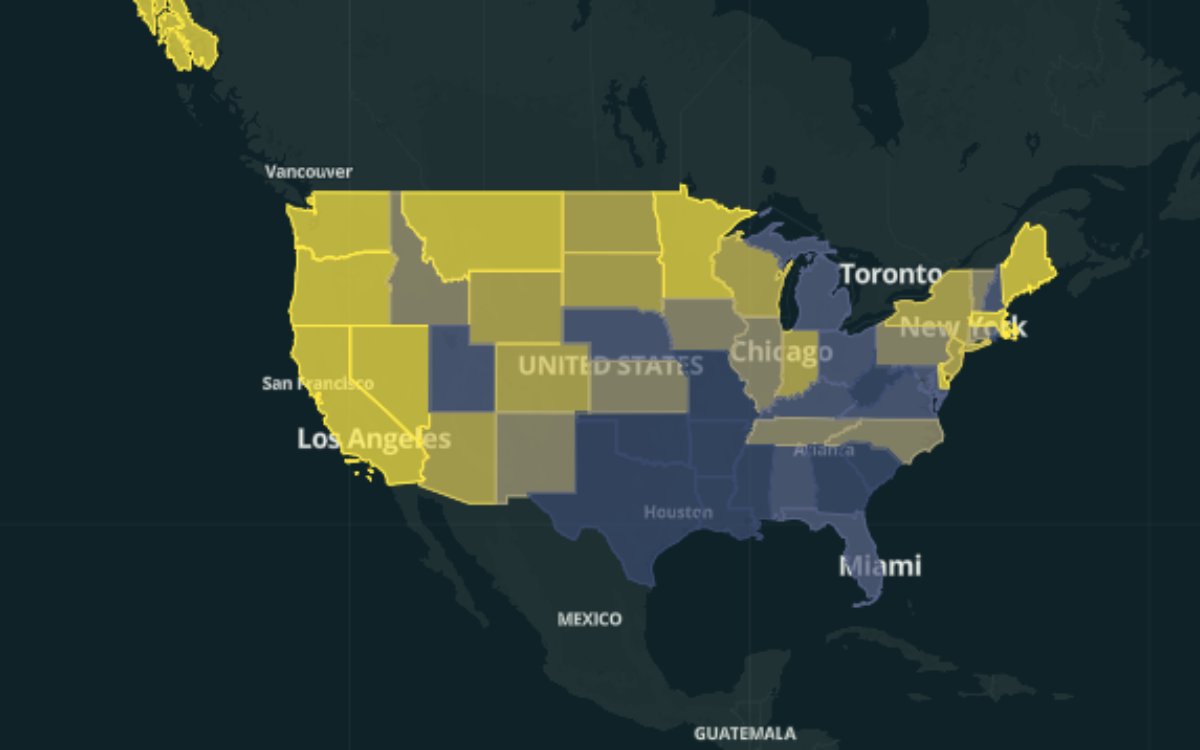
Geospatial salaries by state: BLS OEWS May 2025, 15 occupations
State-level wage statistics for the 15 geospatial and geospatial-adjacent occupations (cartographers and photogrammetrists, surveyors, geographers, surveying and mapping technicians, urban and regional planners, software developers, data scientists, and more), joined to Census state boundaries. One feature per state, with each occupation’s statistics as columns: median, mean, and 10th/25th/75th/90th percentile annual wages (cartographers_median, cartographers_p90, planners_median, and so on). 51 features covering the 50 states and DC; suppressed state-occupation combinations omit the column, never zero. Load it in QGIS and style by any *_median column for an instant choropleth. The map shown colors states by surveyors_median.
pmtilesDatensatzErstellt Erstellt: auf The Spatial Net angelegtBLS Public Data API v2PostgreSQLPythonGDAL+1Aktualisiert vor 16 Tagen
Neue Arbeiten per E-Mail
Erhalten Sie gelegentlich eine Zusammenfassung, wenn neue Arbeiten veröffentlicht werden: gebündelt, nie eine E-Mail pro Beitrag. Nur mit Zustimmung. Jederzeit abbestellbar.
Melden Sie sich an, um den Arbeits-Digest zu abonnieren.